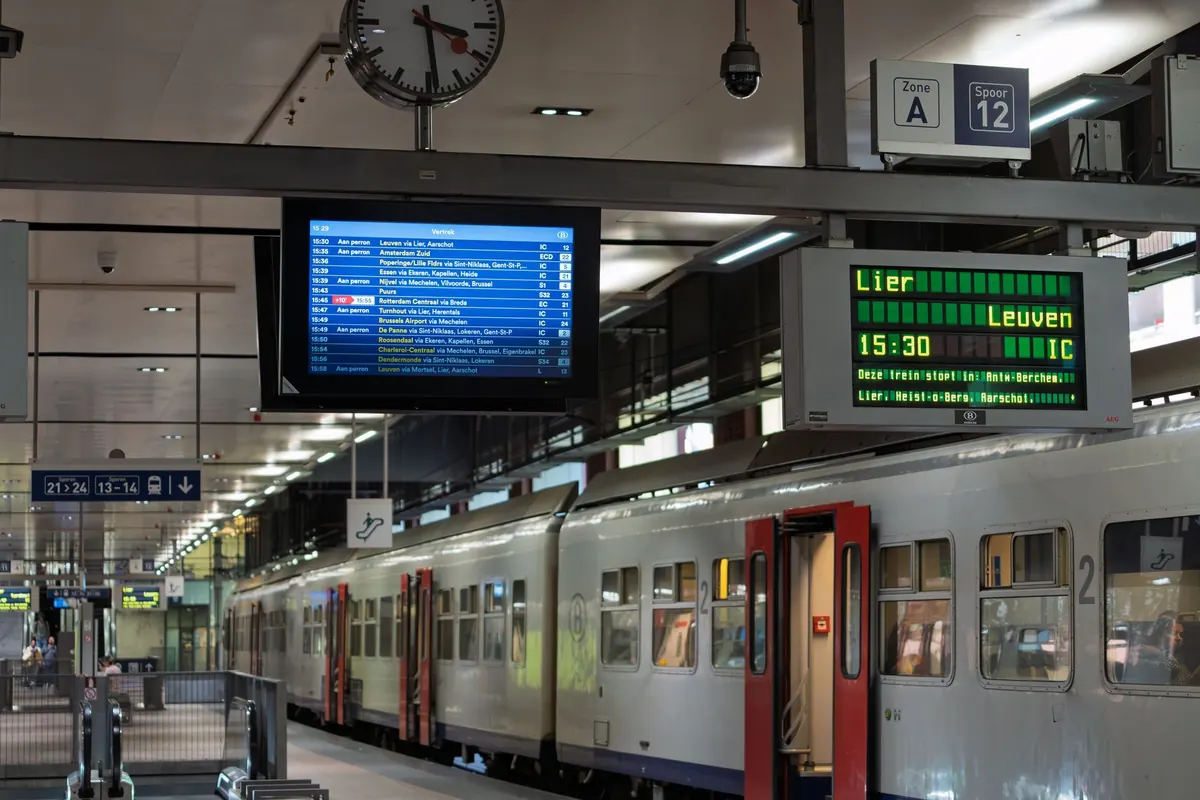
Tide tables look like the most straightforward document in the world: a harbour name, a column of times, a column of heights. Then you stand at a slipway at 06:00 with a boat on a trailer and discover the water is a metre lower than you allowed for.
The predictions are usually right. The misreading almost always comes from the assumptions we bring to them — which clock the times are on, what the heights measure, and whether the numbers actually describe the water in front of us. These are the seven mistakes that come up again and again, with the practical fix for each.
Most UK tide tables are printed in local time, which means GMT in winter and BST in summer. Others stay on UTC or GMT all year and say so in small print at the top of the page. Both are perfectly normal, and mixing them up shifts every time by an hour — often the difference between crossing a bar with water beneath you and arriving there at a state of tide you didn’t plan for.
If you are comparing a printed table with a chartplotter, a phone app or a foreign source, the clocks may not match at all. Pick one standard — UTC is the safest — and convert everything into it before you compare. Then write your own working list in 24-hour time. A good share of misreadings are really 12-hour clock problems.
Those heights are measured above chart datum: a low reference level set so the sea rarely drops below it. In UK waters it sits close to lowest astronomical tide. On its own it tells you nothing about the depth of water, because the soundings printed on the chart are measured down from the same datum. The shallow patch marked 1.2 m, with a tide height of 3.4 m, has about 4.6 m of water over it.
Different datums cause a second, quieter mistake. Ordnance Datum (Newlyn), used for land levels and flood maps, sits around mean sea level and is a different reference entirely — in many UK ports the two differ by a metre or two. Heights quoted against one are not tide heights quoted against the other, and swapping them without noticing is a common error when checking a causeway or a harbour wall.
Standard port tables apply to one gauge in one harbour. Secondary port corrections give a time difference and a height difference for other places, and they are approximations rather than measurements. Up an estuary, around a headland or across a shallow bay the tide can be an hour or more out of step with the standard port, and higher or lower with it. Some places behave oddly: Southampton Water and Poole Harbour both have double high waters, where the tide barely falls between two peaks.
The fix is unglamorous. Use the nearest standard port, then find out how the water in front of you differs. Ask at the harbour office, a sailing club or a boatyard. People who work the same stretch every day know more about it than any table.
Range changes through the fortnight. Spring tides arrive a day or two after a new or full moon, when high water can stand a metre or more above a neap high water; neaps fall near the quarter moons. The word has nothing to do with the season.
The consequence is that “high water” is not one fixed height. A passage that clears a sill comfortably on springs may not clear it at the same clock time a week later on neaps, in identical weather. If your table has a springs-and-neaps column, use it. If not, note the moon phase and expect a range somewhere between the two extremes.
Tables vary in ways that catch people out, particularly around midnight and in how times are rounded:
Read the table as a sequence rather than a grid. Work out what happens across the 24 hours you actually care about, then count backwards from the moment that matters.
Predictions come from the astronomical tide and are usually good to a few centimetres in calm weather. They contain no weather. Sustained low pressure and onshore wind push water up; high pressure and offshore wind hold it back. A rough working rule is about 1 cm of sea level for each millibar away from roughly 1013 mb, so a deep winter low can add half a metre or more, and storm surges add more still.
Timing moves too, especially in shallow water and estuaries. Allow 10–20 cm either side as normal, more in unsettled conditions, and never plan a marginal passage on the assumption that the table is exact.
High and low water are instants, not states. The water moves fastest around mid-tide and nearly stops at the turns. The rule of twelfths is a useful approximation: in the first hour after low water about a twelfth of the range has come in, then two twelfths, then three, three, two and one.
That has a practical bite. If you need half a metre over a bar on a 4 m range, and there is 0.4 m at low water, waiting an hour gains you roughly 0.3 m — not enough. Wait longer, or go elsewhere. Remember too that the height is measured at the gauge, not over your obstacle, so add your draft, squat and under-keel clearance before deciding.
Before you rely on any table, run through six checks:
Answer those and the table stops being a trap. For anywhere unfamiliar — a bar, a lock, a drying mooring — check with the harbour authority and take local advice before you set out.
Photo: Martijn Stoof / Pexels
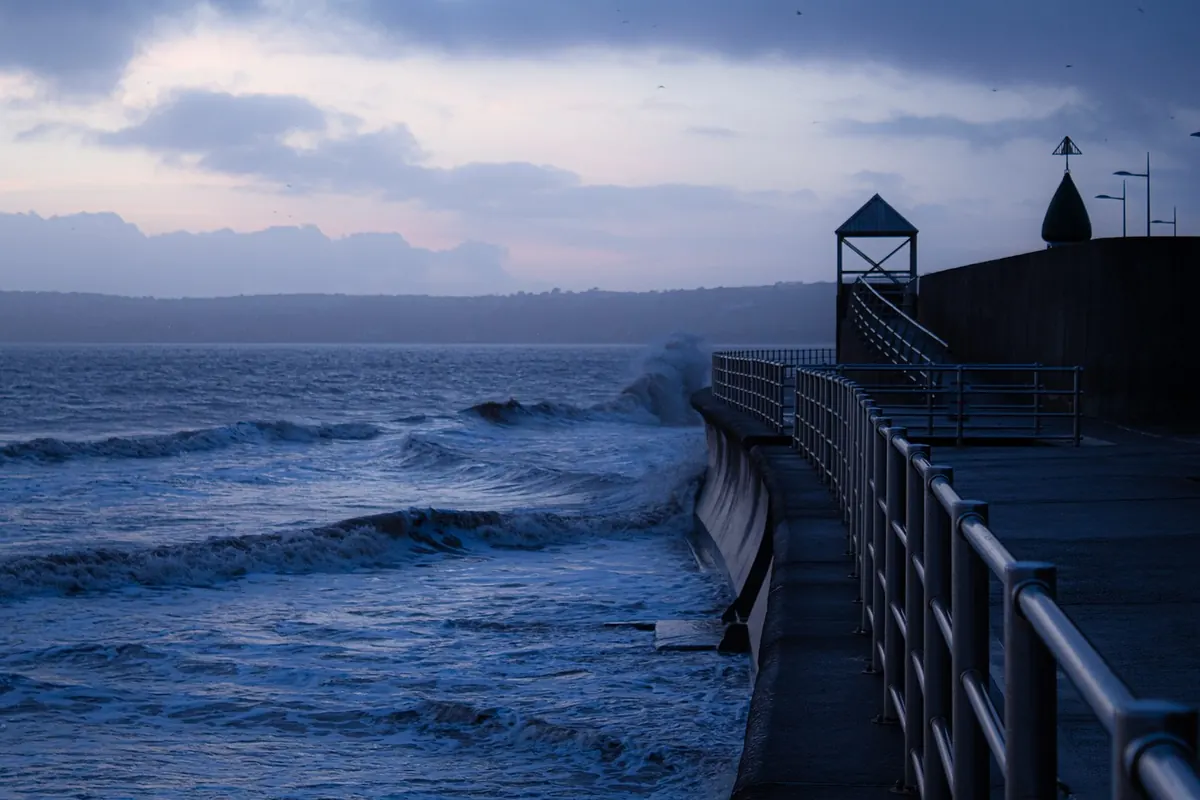
Combine tide tables, storm surge forecasts and official weather warnings to judge winter coastal flood risk — plus a...
Chart datum is the baseline behind every UK tide height. Here's how to read predictions properly, add them to...

A practical checklist for dog owners on UK coasts and estuaries, covering tide tables, the rule of twelfths, cut-off...

Your daily guide to tides and coastal conditions.
